
Watch trailer
Course at a glance
Included in these subscriptions:
- Dev & IT Pro Video
- Dev & IT Pro Power Pack
| Release date | 12/18/2013 | |
| Level | Intermediate | |
| Runtime | 1h 48m | |
| Closed captioning | Included | |
| Transcript | Included | |
| eBooks / courseware | Included | |
| Hands-on labs | Included | |
| Sample code | Included | |
| Exams | Included |
Course description
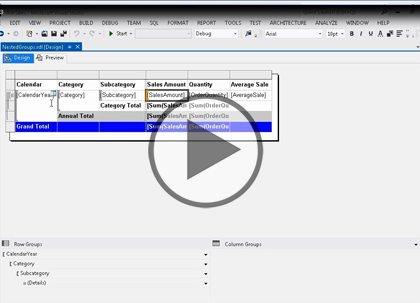
In this course we’ll start by taking a look at the tablix, and how it is able to morph into a table, matrix, and list at your whim, then we’ll put it to use and build a report using the component, exploring its features. As with most Microsoft development objects, the tablix has a large number of properties you can use to customize how it appears and behaves in a report. We’ll wrap up the course by exploring the properties unique to the tablix, so that you’ll know exactly where to go to make it do what you need.
Prerequisites
This course assumes that you have a basic familiarity with the concept of relational databases and a basic understanding of what SQL Server is and the high-level tools in it, as well as how to create and manage objects using Management Studio. You should also have a basic understanding of how SQL Server implements security, including its authentication and authorization schemes, and how to assign permissions on securable objects to principals. You should know the fundamentals of Transact-SQL to write queries to retrieve data and join data from multiple tables, and how to execute scripts using the query editor in Management Studio.
It will be very helpful, but not absolutely necessary, to have experience with .NET development using Visual Studio 2010 or 2012 for the portions of the course that deal with SQL Server Data Tools. At the very least, we’ll assume that you are well familiar with the Visual Studio user interface.
The focus of this course is the Reporting Services Native Mode installation to learn the fundamentals of creating and managing reports. Almost all of what you’ll learn will be applicable to a SharePoint integrated mode installation as well, but there are additional tools and considerations for SharePoint that aren’t covered thoroughly here.
This course is written using Windows 7 and 8.1, and taped using Windows 7, using SQL Server 2012. For Windows, we assume you know how to start programs, etc. in whatever version of Windows you’re using. The Reporting Services features should be pretty much the same in SQL Server 2014, although some windows will probably look different; but the feature set is the same.
Learning Paths
This course is part of the following LearnNowOnline SuccessPaths™:
SQL Server Reporting Services
Meet the expert

Don Kiely is a featured instructor on many of our SQL Server and Visual Studio courses. He is a nationally recognized author, instructor, and consultant specializing in Microsoft technologies. Don has many years of teaching experience, is the author or co-author of several programming books, and has spoken at many industry conferences and user groups. In addition, Don is a consultant for a variety of companies that develop distributed applications for public and private organizations.
Course outline
Tablix Reports
Exploring the Tablix Report (29:51)
- Introduction (00:43)
- Exploring the Tablix Report (01:27)
- The Tablix Component (01:24)
- Table Data Region (01:08)
- Demo: Table (03:17)
- Demo: TableDemo (04:26)
- Demo: Table Data (01:16)
- Matrix Data Region (00:41)
- Demo: Matrix (01:26)
- Demo: MatrixDemo (04:28)
- Demo: Grouping (00:59)
- List Data Region (00:53)
- Demo: List (02:57)
- Demo: ListDemo (03:57)
- Summary (00:42)
Tablix Cell Content & Scope (09:43)
- Introduction (00:30)
- Cell Content (02:10)
- Cell Scope (01:36)
- Demo: Cells (04:55)
- Summary (00:31)
Building a Tablix Report (05:43)
- Introduction (00:33)
- Demo: Creating a Project (02:00)
- Demo: Connection String (02:41)
- Summary (00:29)
Tabular, Matrix, and Lists
Building a Tabular Report (16:45)
- Introduction (00:24)
- Demo: Create a Tabluar Report (03:30)
- Demo: Grouping (03:42)
- Demo: Totals (03:53)
- Demo: Report Formatting (04:48)
- Summary (00:25)
Building a Matrix Report (11:50)
- Introduction (00:40)
- Demo: Matrix Report (04:45)
- Demo: Matrix Preview (00:24)
- Demo: Totals (02:34)
- Demo: Matrix Formatting (02:56)
- Summary (00:28)
Building a List Report (19:50)
- Introduction (00:44)
- Demo: List Report (04:42)
- Demo: Columns (05:01)
- Demo: More Rows (04:44)
- Summary (00:20)
- Tablix Properties Dialog Box (00:32)
Tablix Properties and Groups (14:17)
- Introduction (00:33)
- Tablix Properties Dialog Box (00:32)
- Demo: Tablix Properites (04:11)
- No Data Rows (00:42)
- Demo: No Data Rows (00:57)
- Groups Before Row Headers (01:09)
- Synchronized Data Alignment (00:23)
- Demo: Misaligned Data (02:37)
- Demo: Align Data (02:43)
- Summary (00:25)